Artificial Intelligence Tool Lucidchart

DESCRIPTION
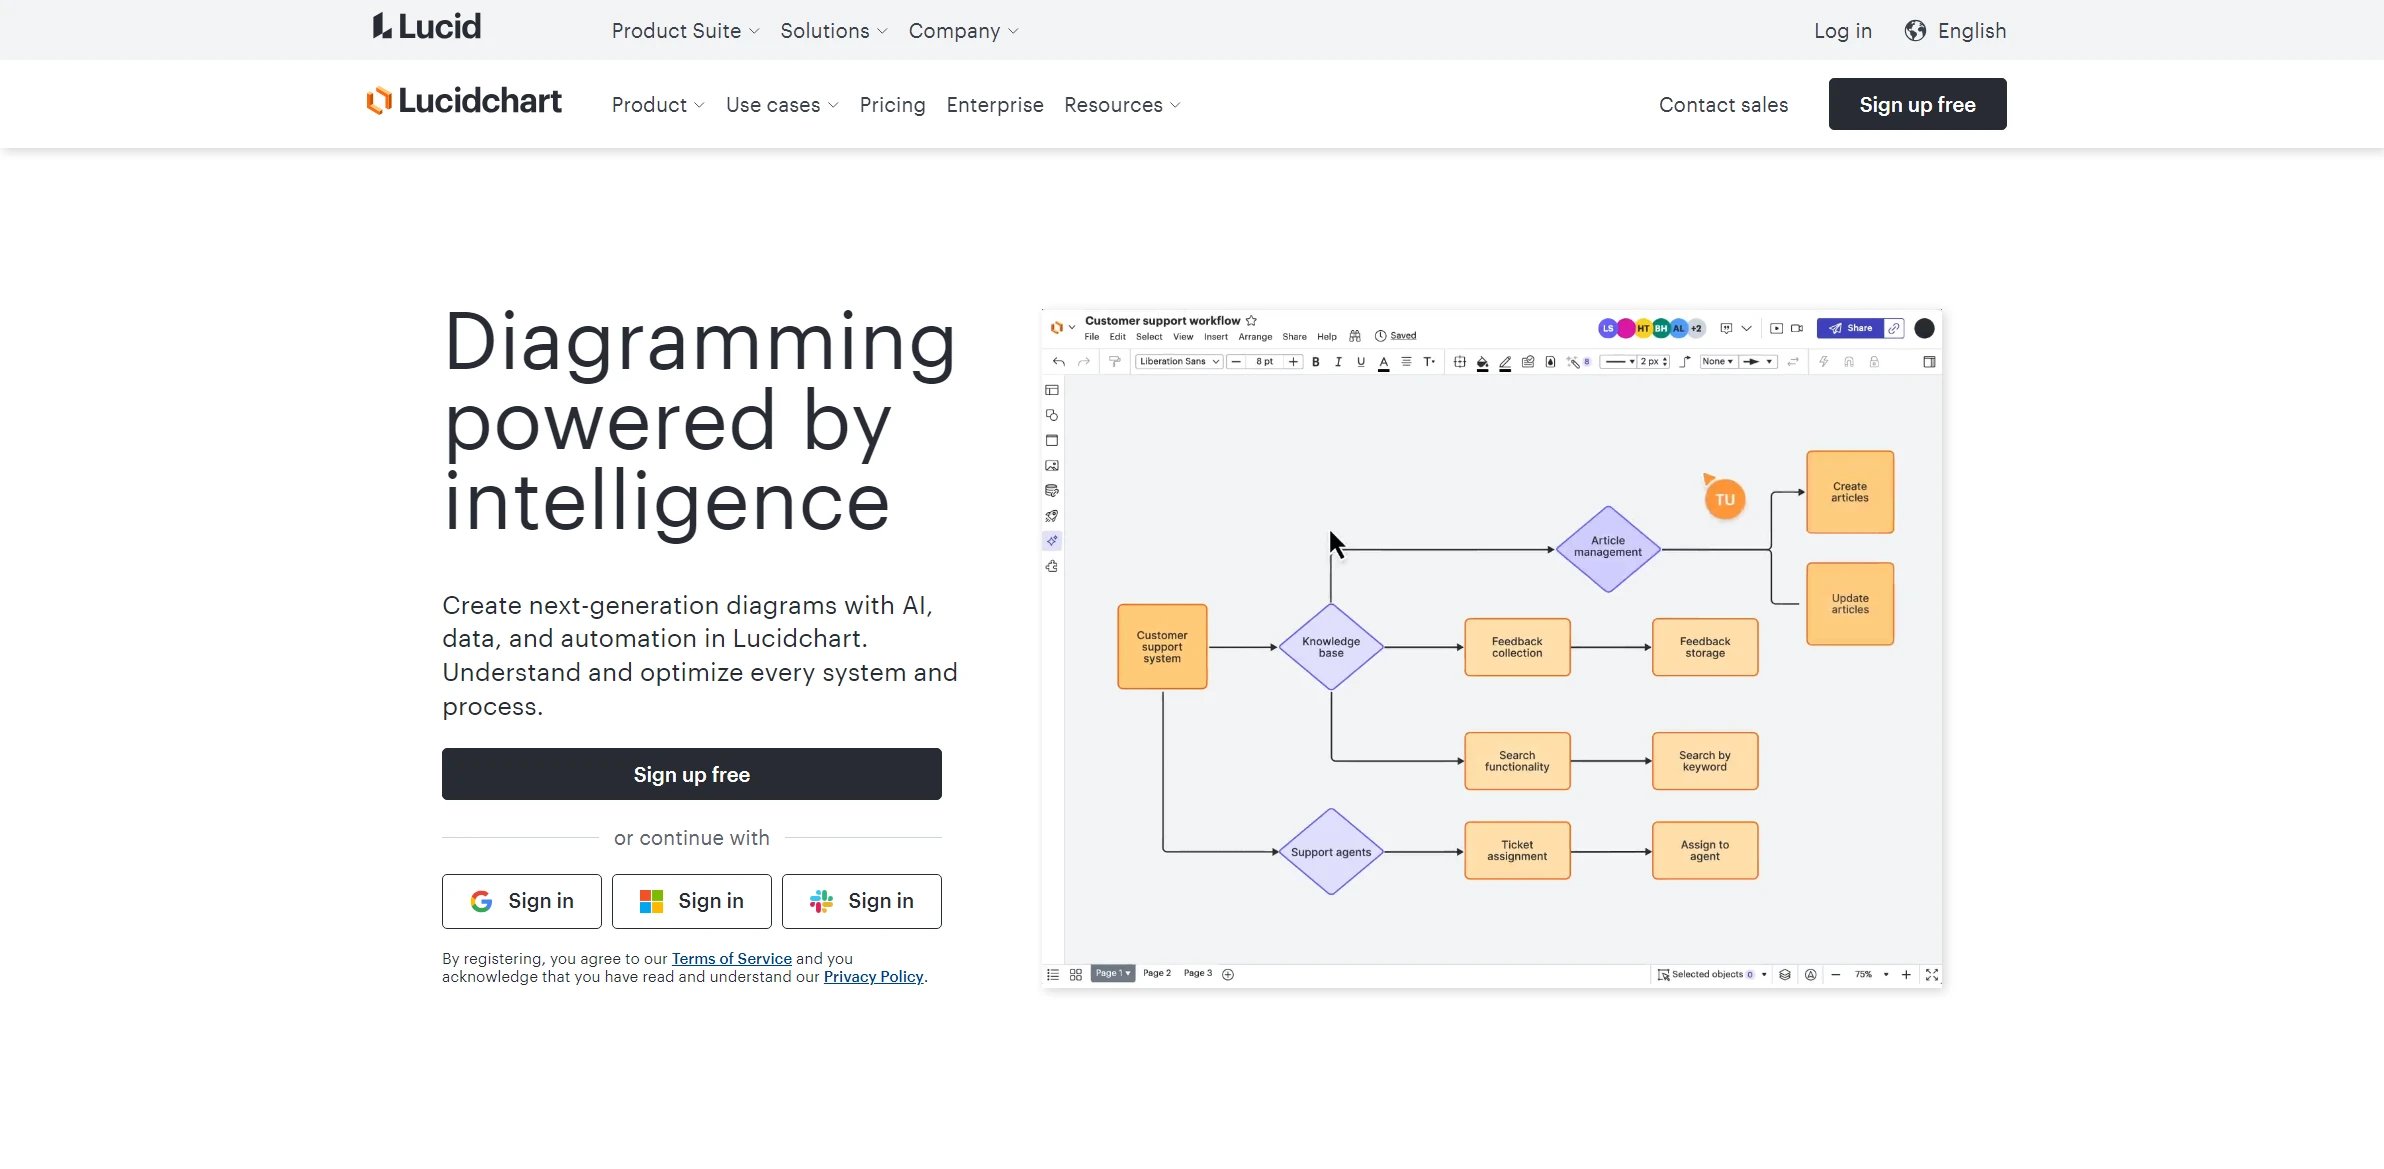
Lucidchart is a powerful diagramming application that empowers users to create a wide array of visual representations, from flowcharts to organizational charts, and even complex network diagrams. This cloud-based tool is designed to foster collaboration among teams, making it an invaluable resource for professionals across various industries. With an intuitive drag-and-drop interface, users can easily integrate shapes, connectors, and other elements to illustrate ideas clearly and effectively. The platform’s versatility allows it to be used for brainstorming sessions, project planning, and even software development, enhancing productivity and clarity in communication.
A standout feature of Lucidchart is its real-time collaboration capability. Multiple users can work on a single document simultaneously, allowing for instantaneous feedback and adjustments. This is particularly beneficial for remote teams or departments that operate across different locations. As changes are made, all participants can see updates in real time, which reduces the chances of miscommunication and ensures that everyone is on the same page. This feature not only streamlines workflow but also fosters a sense of teamwork as individuals can contribute their insights and ideas collectively.
The practical impact of Lucidchart’s real-time collaboration is profound, especially in fast-paced environments where time is of the essence. For instance, in a software development project, teams can visualize system architectures and workflows collaboratively, making it easier to spot potential issues before they escalate. By leveraging Lucidchart, organizations can enhance their project management processes, leading to more efficient outcomes and better alignment among stakeholders. Ultimately, Lucidchart serves as a bridge between ideas and execution, facilitating smarter decision-making through visual communication.
Why choose Lucidchart for your project?
Lucidchart stands out for its intuitive interface and real-time collaboration features, making it ideal for teams working on complex projects. Users can create detailed flowcharts, network diagrams, and organizational charts effortlessly, fostering clearer communication. Its integration with popular platforms like Google Workspace and Microsoft Office enhances workflow efficiency. The ability to import and export Visio files caters to diverse user needs. Additionally, Lucidchart’s extensive shape library supports various industries, from software development to marketing. Its templates streamline the design process, while the cloud-based access ensures your work is safe and accessible from anywhere.
How to start using Lucidchart?
- Sign up or log in to your Lucidchart account on the official website.
- Select “Create New Document” to start a new diagram or flowchart.
- Choose a template or start with a blank canvas to design your diagram.
- Use the drag-and-drop interface to add shapes, lines, and text to your diagram.
- Save and share your document with collaborators or export it in your desired format.
PROS & CONS
 User-friendly interface that simplifies the process of creating complex diagrams.
 Offers real-time collaboration features, allowing multiple users to work on diagrams simultaneously.
 Integrates seamlessly with various productivity tools, enhancing workflow efficiency.
 Provides a wide range of templates and shapes, catering to diverse diagramming needs.
 Supports cloud storage, ensuring easy access to diagrams from any device at any time.
 Limited offline functionality can hinder users who need access without an internet connection.
 Subscription costs may be higher compared to some alternative diagramming tools.
 The learning curve for new users can be steep due to a wide array of features and options.
 Collaboration features might not be as robust as those found in some competing platforms.
 Integration with other software may be limited compared to other diagramming solutions.
USAGE RECOMMENDATIONS
- Familiarize yourself with the user interface by exploring the various features and toolbars available.
- Utilize templates to quickly create diagrams and flowcharts that suit your specific needs.
- Take advantage of the collaborative features to share diagrams with team members and gather feedback in real-time.
- Use layers to organize complex diagrams, making them easier to read and navigate.
- Incorporate data linking to connect your diagrams with live data from external sources for dynamic updates.
- Experiment with different shapes and icons to enhance the clarity and visual appeal of your diagrams.
- Leverage the integration options with other tools like Google Drive, Microsoft Teams, or Slack for streamlined workflows.
- Make use of the revision history feature to track changes and revert to earlier versions if necessary.
- Utilize the export options to save your diagrams in various formats (PDF, PNG, etc.) for easy sharing and presentation.
- Stay updated with Lucidchart’s latest features and improvements by following their blog or release notes.
SIMILAR TOOLS

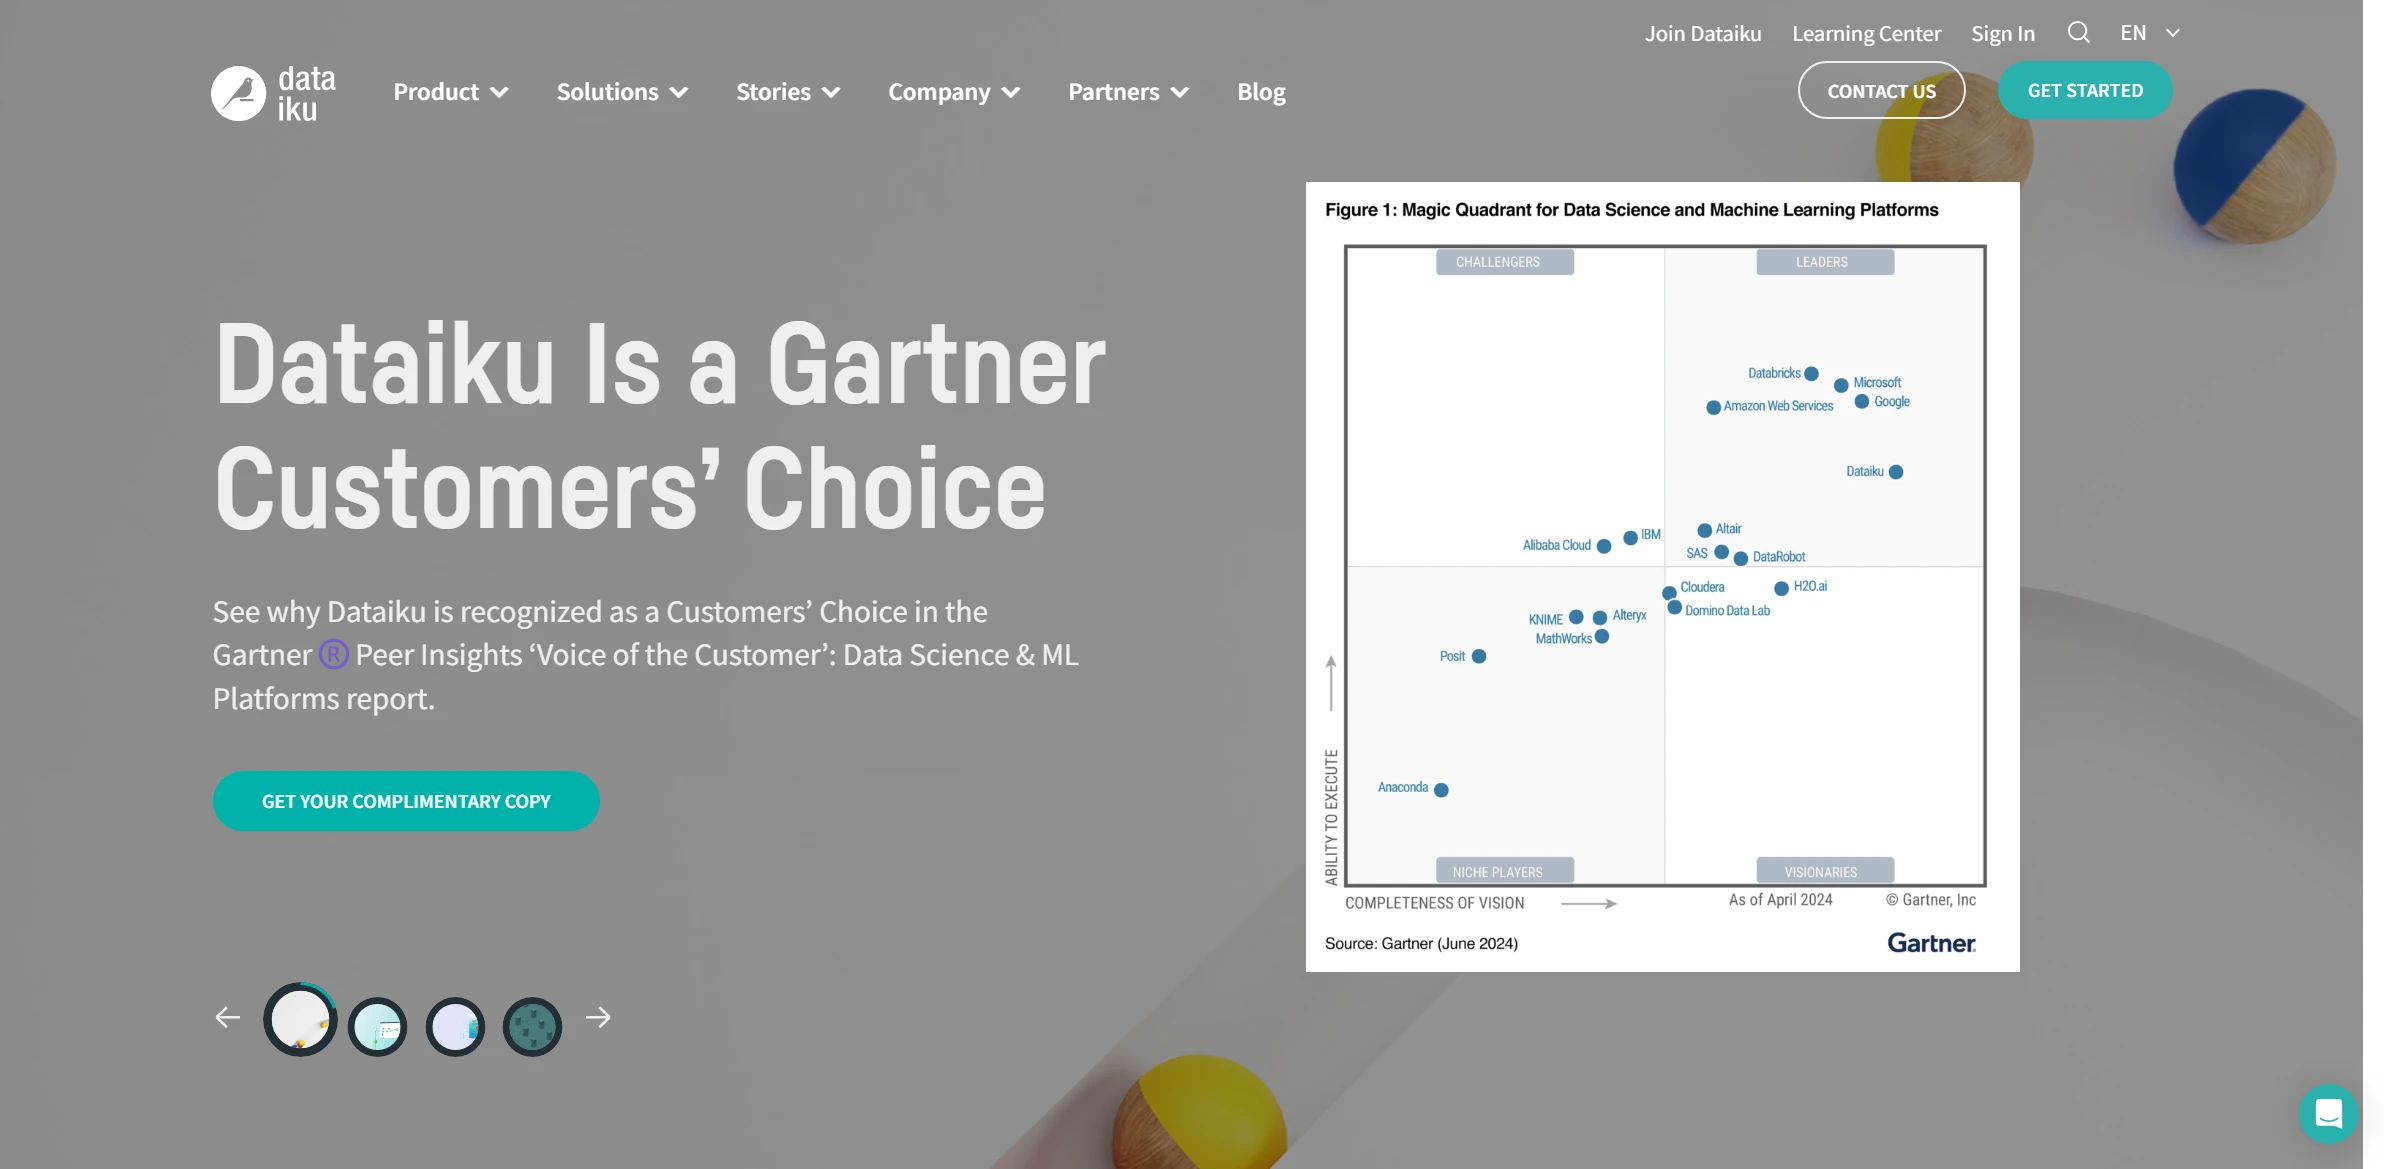
Dataiku
Automate machine learning experiments with tools that ensure efficient tracking and advanced control.
Visit Dataiku
Weights & Biases
Explore advanced visual analytics to discover key insights in data with an intuitive and powerful interface.
Visit Weights & Biases
HuggingFace
Simplify complex NLP and machine learning tasks with this powerful and adaptable tool.
Visit HuggingFace