Artificial Intelligence Tool Piktochart

DESCRIPTION
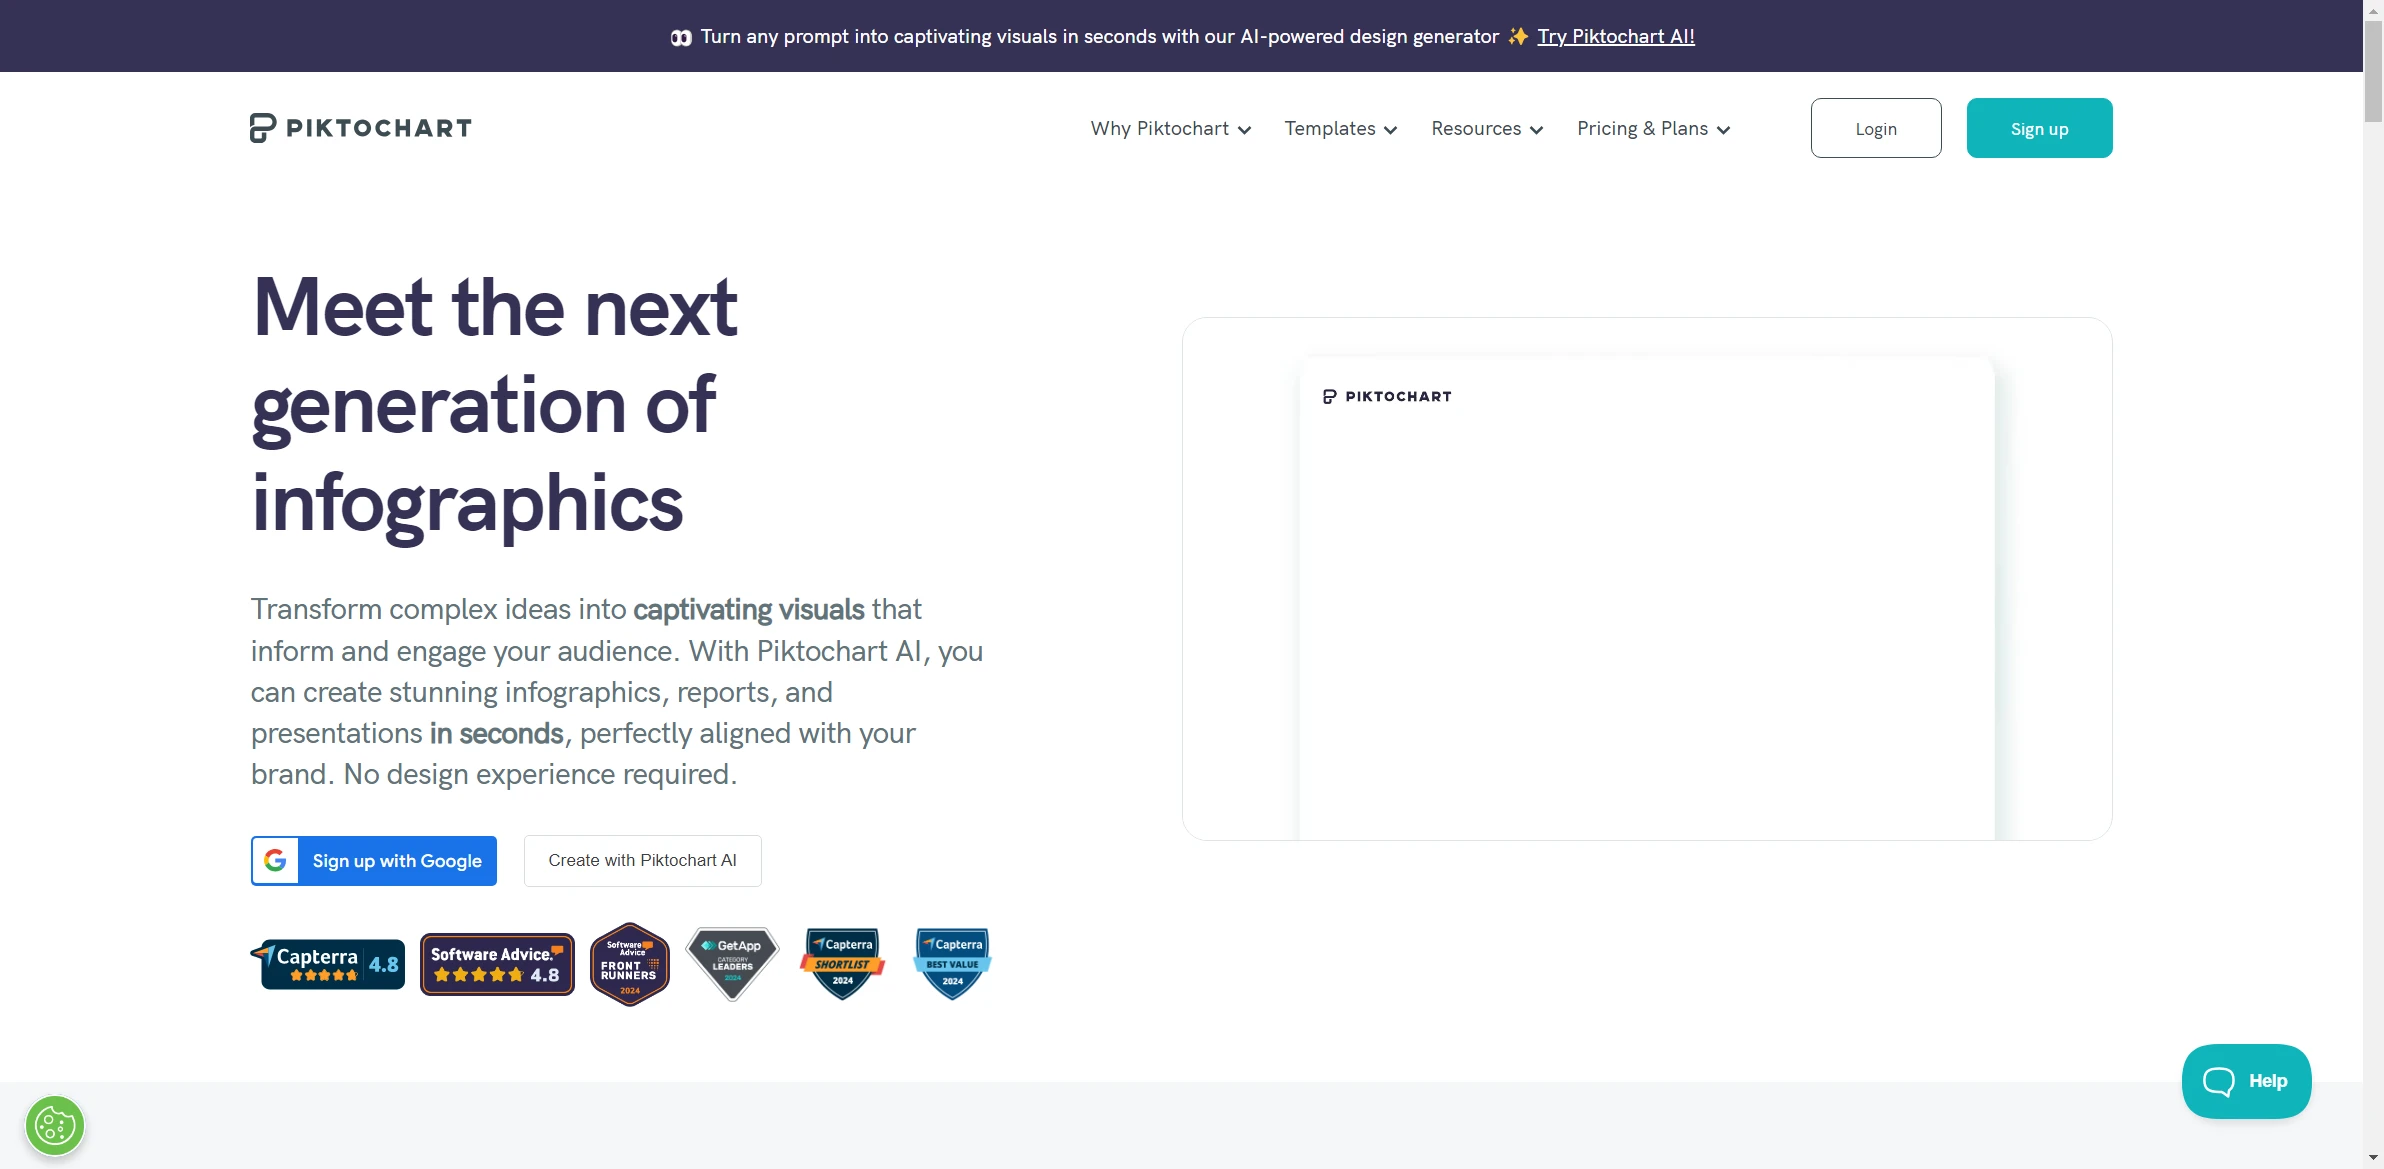
Piktochart is an innovative web-based tool designed to simplify the creation of infographics, presentations, and reports. Catering to users ranging from educators to marketers, Piktochart offers a user-friendly interface that allows individuals to transform complex data into visually appealing graphics. With a wide array of templates, icons, and design elements, users can easily customize their projects to align with their branding or personal style. This versatility makes it an invaluable resource for those looking to communicate information effectively and attractively.
One of Piktochart’s standout functionalities is its data visualization feature, which enables users to create charts and graphs that are both interactive and informative. This feature allows users to import data from various sources, such as spreadsheets, and visualize it in real time. By doing so, it not only enhances the aesthetic appeal of presentations but also improves audience engagement and understanding. The ability to present data in a clear and concise manner significantly impacts decision-making processes in business contexts, as stakeholders can grasp insights quickly and effectively.
Moreover, Piktochart’s collaborative capabilities further enhance its practical impact. Teams can work together seamlessly, sharing projects and providing feedback in real time. This functionality fosters a more interactive workflow, allowing for immediate revisions and collective brainstorming. With its emphasis on collaboration, Piktochart empowers organizations to harness the collective creativity and expertise of their members, ultimately leading to higher-quality visual content and more impactful communication strategies.
Why choose Piktochart for your project?
Piktochart stands out for its user-friendly interface, enabling even non-designers to create stunning visuals effortlessly. Its extensive library of templates caters to diverse needs, from infographics to presentations, making it ideal for marketers and educators. The platform’s integration with data visualization tools allows users to transform complex data into engaging graphics, enhancing comprehension. Customization options empower users to align visuals with branding. Additionally, Piktochart’s collaborative features enable real-time teamwork, streamlining project workflows. Practical use cases include crafting compelling reports, educational materials, and social media graphics, ensuring impactful communication tailored to specific audiences.
How to start using Piktochart?
- Sign up or log in to your Piktochart account on the official website.
- Select a template that fits your project type, such as infographics, presentations, or reports.
- Customize the chosen template by adding your own text, images, icons, and charts using the drag-and-drop interface.
- Utilize the design tools to adjust colors, fonts, and layouts to match your branding or style preferences.
- Once satisfied with your design, download your project or share it directly via social media or a link.
PROS & CONS
 User-friendly interface that simplifies the design process, making it accessible for individuals with no graphic design experience.
 A wide range of customizable templates and visuals that can cater to various industries and presentation needs.
 Collaboration features that allow multiple users to work on designs simultaneously, enhancing team productivity.
 Integration with other tools and platforms, facilitating easy sharing and embedding of visuals across different mediums.
 Regular updates and new features that keep the tool relevant and aligned with current design trends and user needs.
 Limited customization options compared to some advanced graphic design tools.
 May not provide as extensive a library of templates as other platforms.
 Performance can be slower when handling large files or complex designs.
 Subscription costs can add up for premium features that may be available for free elsewhere.
 Collaboration features may not be as robust as those offered by some competitors.
USAGE RECOMMENDATIONS
- Start with a clear objective for your project to guide your design choices.
- Utilize the templates available in Piktochart to save time and get inspiration.
- Incorporate high-quality visuals and graphics to enhance your presentation.
- Experiment with different color schemes to find the one that best represents your brand.
- Use charts and infographics to present data in an engaging way.
- Keep text concise and to the point to maintain audience attention.
- Regularly preview your design to ensure it looks good on different devices.
- Collaborate with team members by sharing your project for feedback and edits.
- Make use of the built-in icons and illustrations to add visual interest.
- Export your finished project in various formats depending on your needs (e.g., PNG, PDF).
SIMILAR TOOLS

Crello AI
Crello AI is an innovative design tool that harnesses the power of artificial intelligence to simplify the creative process for users, regardless of their design expertise. Developed as a part…

Wombo Art
Wombo Art is an innovative artificial intelligence tool that allows users to generate stunning pieces of artwork from simple text prompts. Utilizing advanced algorithms, it transforms user-inputted descriptions into vivid,…

Image Larger
Image Larger is an advanced software application designed to enhance the resolution of digital images while preserving their original quality. Utilizing cutting-edge algorithms, the tool intelligently increases the size of…

Playground AI
Playground AI is an innovative artificial intelligence tool that empowers users to create and experiment with various AI-generated content. At its core, Playground AI provides a user-friendly interface that allows…

